July 2024

Celebrating Excellence: Bybit Rises to No.2 in Spot Market Share and Presents the Community with Exciting Opportunities

Celebrating Excellence: Bybit Rises to No.2 in Spot Market Share and Presents the Community with Exciting Opportunities

[PRESS RELEASE – Dubai, United Arab Emirates, July 1st, 2024] Bybit, the world’s second-largest web3 platform by trading volume, has recently ascended to the second position in terms of market share. To commemorate this remarkable achievement and extend our heartfelt appreciation to Bybit’s global community, the Spot team is launching a reward program designed to enhance […]

Celebrating Excellence: Bybit Rises to No.2 in Spot Market Share and Presents the Community with Exciting Opportunities Read More »

Shiba Inu (SHIB) Hits a New Major Milestone: Details

Shiba Inu (SHIB) Hits a New Major Milestone: Details

TL;DR Shiba Inu’s layer-2 scaling solution, Shibarium, keeps progressing with total transactions nearing 420 million and wallet addresses exceeding 1.8 million, while daily transactions rose to over 14,000. The SHIB burn rate surged by more than 4,000% in the past 24 hours, removing around 300 million tokens from circulation. Shiba Inu’s Latest Advancement The second-largest

Shiba Inu (SHIB) Hits a New Major Milestone: Details Read More »

Ethereum Price Analysis: ETH Bulls Eye $3,500 as Hopes for a Bottom Escalate

Ethereum Price Analysis: ETH Bulls Eye $3,500 as Hopes for a Bottom Escalate

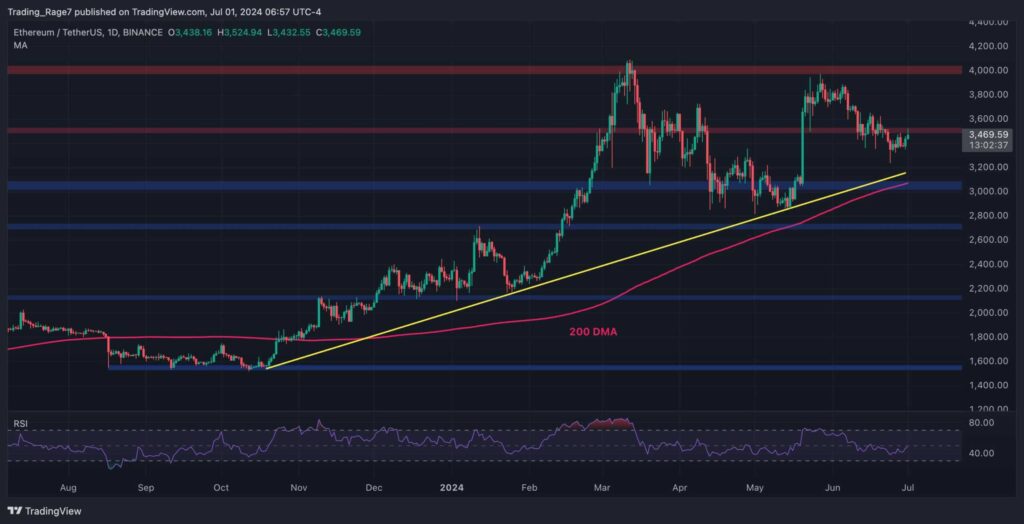
Ethereum’s price is currently trying to penetrate a key level, and if successful, the recent correction could finally be over. Technical Analysis By TradingRage The Daily Chart As the daily chart displays, the Ethereum price has been dropping since getting rejected from the $4,000 resistance level back in May. The market has since dropped below

Ethereum Price Analysis: ETH Bulls Eye $3,500 as Hopes for a Bottom Escalate Read More »

Polkadot Price Analysis: DOT Explodes by 13% Weekly but is the Worst Really Over?

Polkadot Price Analysis: DOT Explodes by 13% Weekly but is the Worst Really Over?

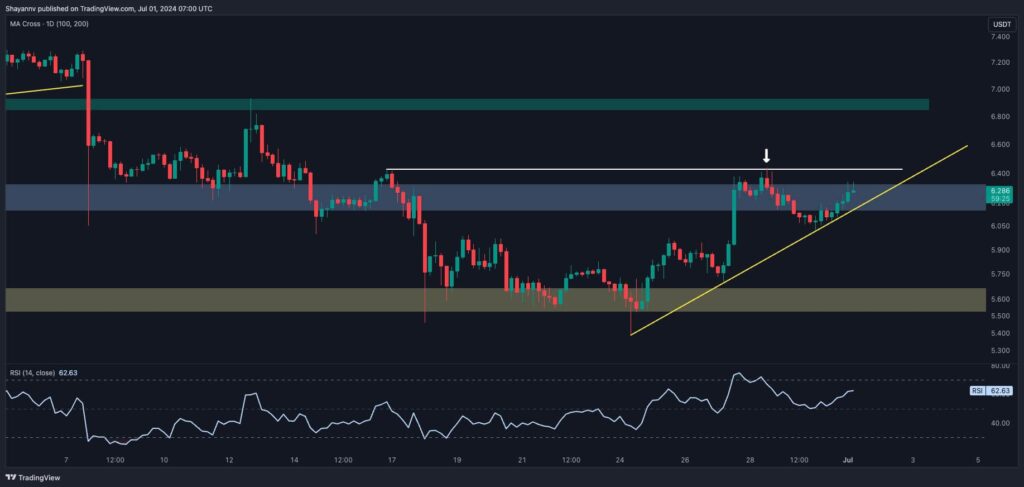
Polkadot has surged towards a crucial resistance region, marked by the multi-month wedge’s upper boundary and the $6.4 threshold. This area is likely filled with significant supply, potentially halting the upward momentum in the short term and leading to a temporary phase of sideways consolidation. Technical Analysis By Shayan The Daily Chart A detailed analysis

Polkadot Price Analysis: DOT Explodes by 13% Weekly but is the Worst Really Over? Read More »

Please enter Coingecko Free Api Key to get this plugin works
Scroll to Top