Polkadot’s price has been on the decline for a while now, since reversing to the downside in March, Yet, the market might recover soon.
Technical Analysis
By TradingRage
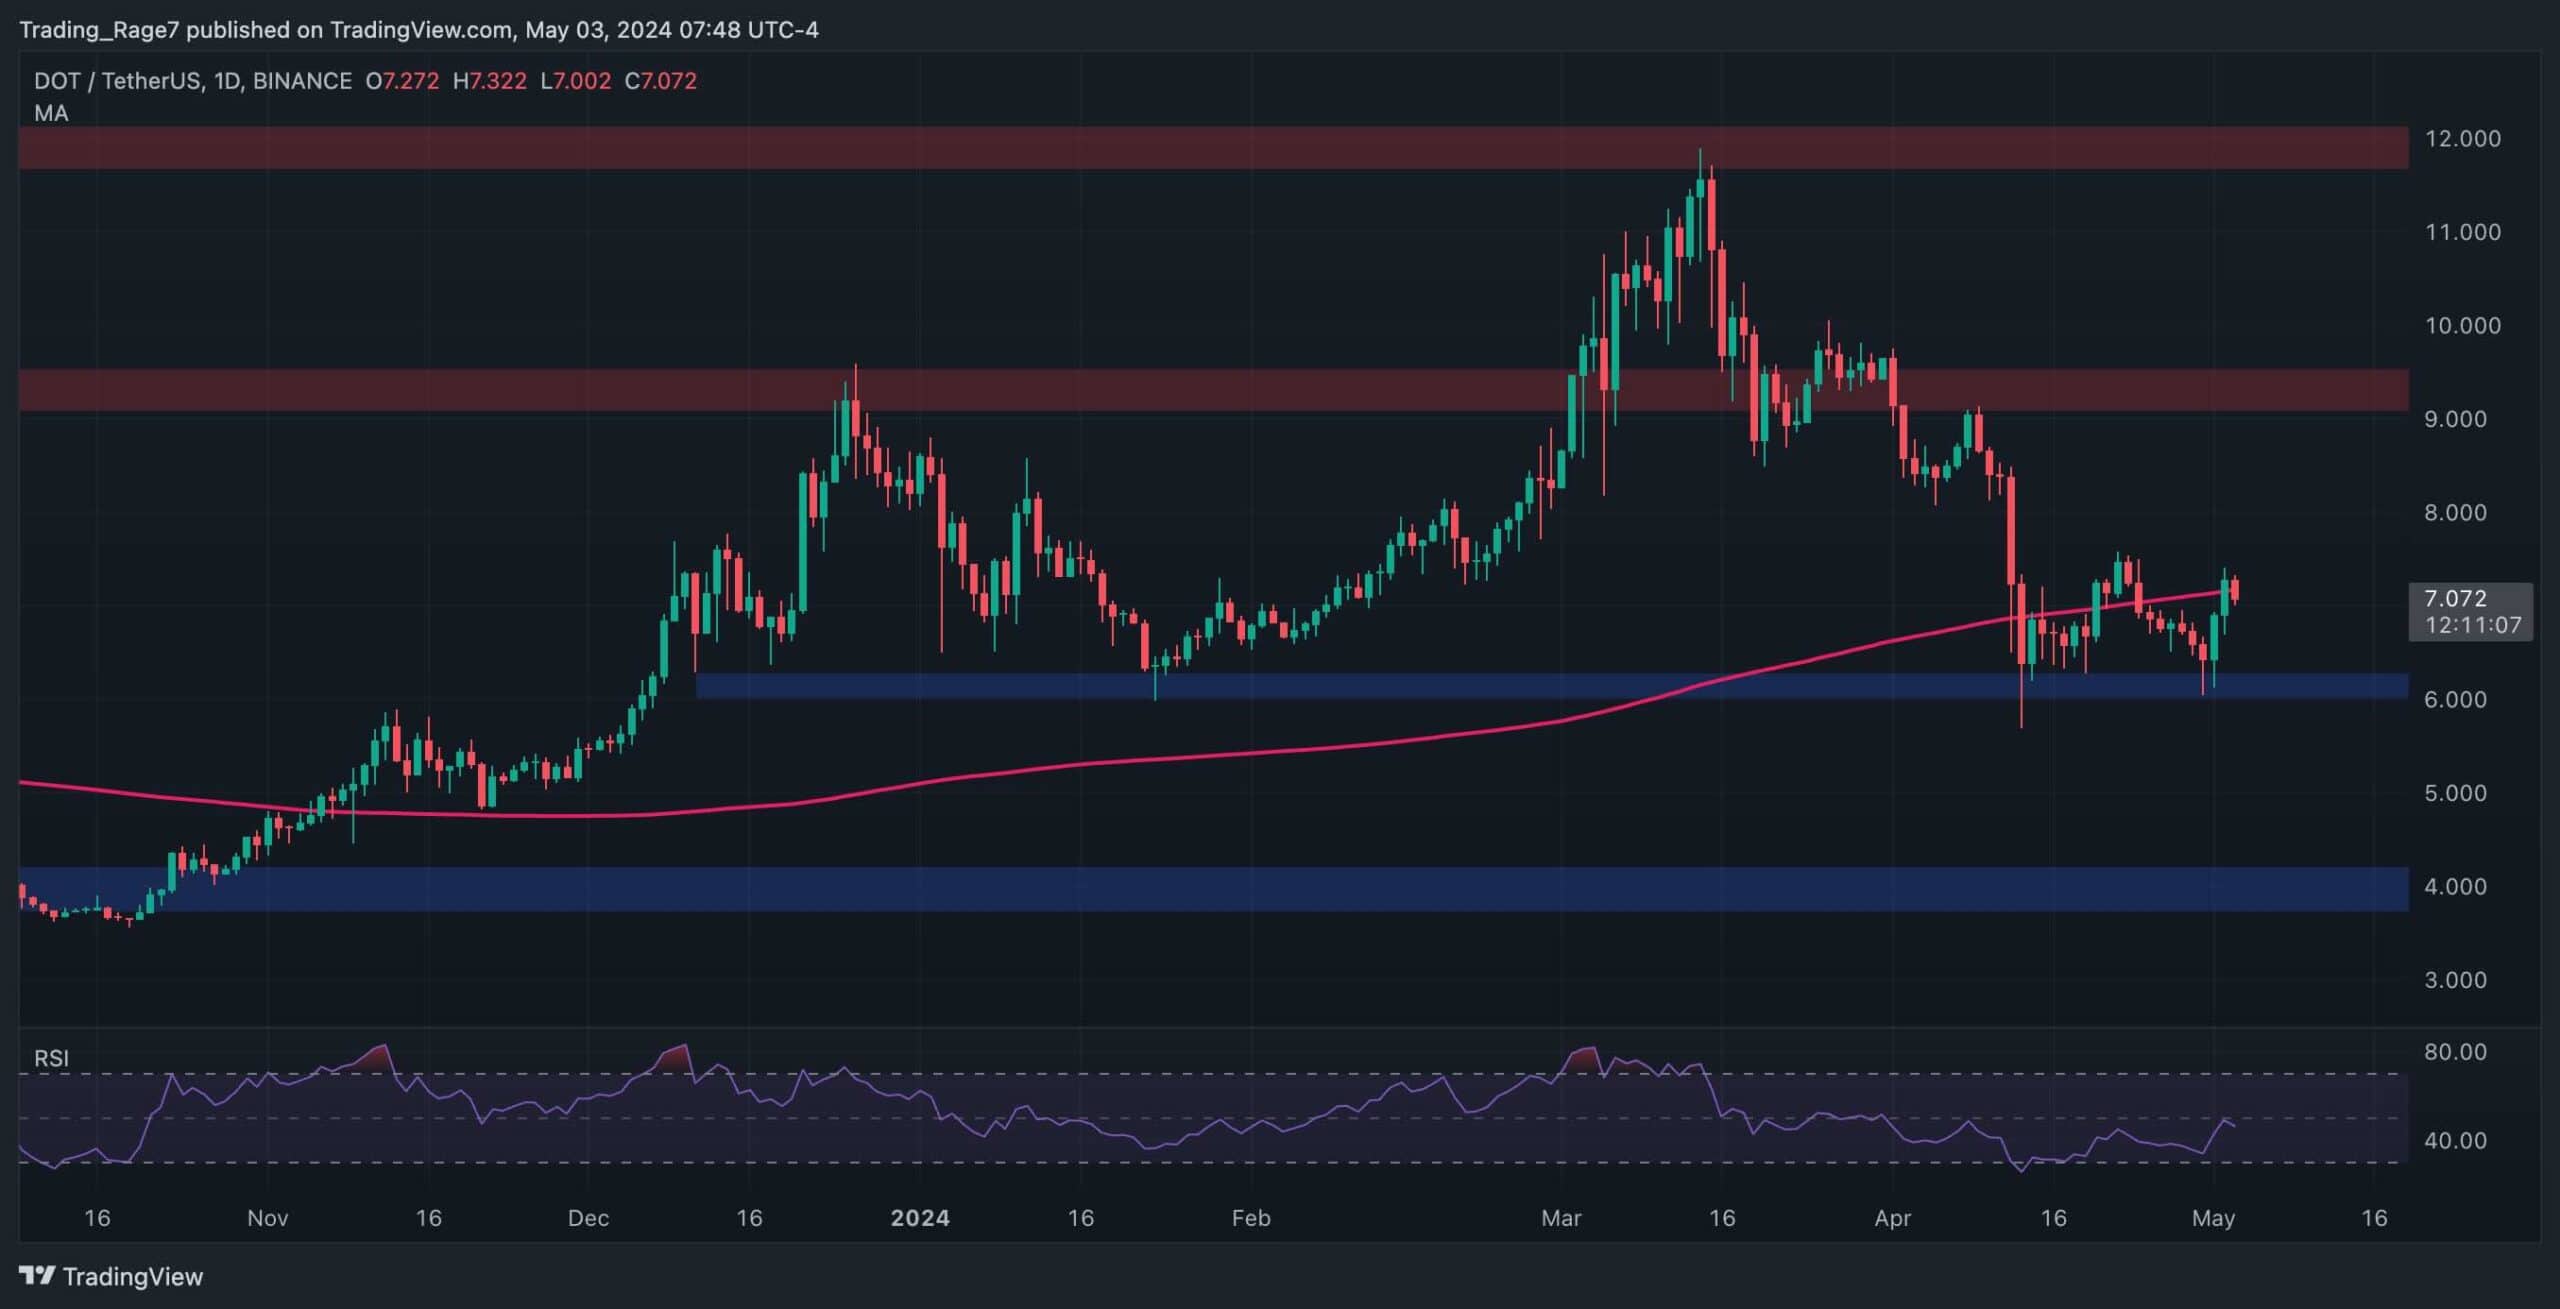
The Daily Chart
On the daily chart, DOT’s price has been making lower highs and lows since being rejected from the $12 resistance level. The $9 mark has also been broken to the downside. The price is currently trading below the 200-day moving average, which is located around $7.2.
Yet, it is testing the moving average at the moment, following a rebound from the $6 support zone. If the market successfully climbs back above the 200-day MA, a recovery toward $9 would be expected in the coming weeks.
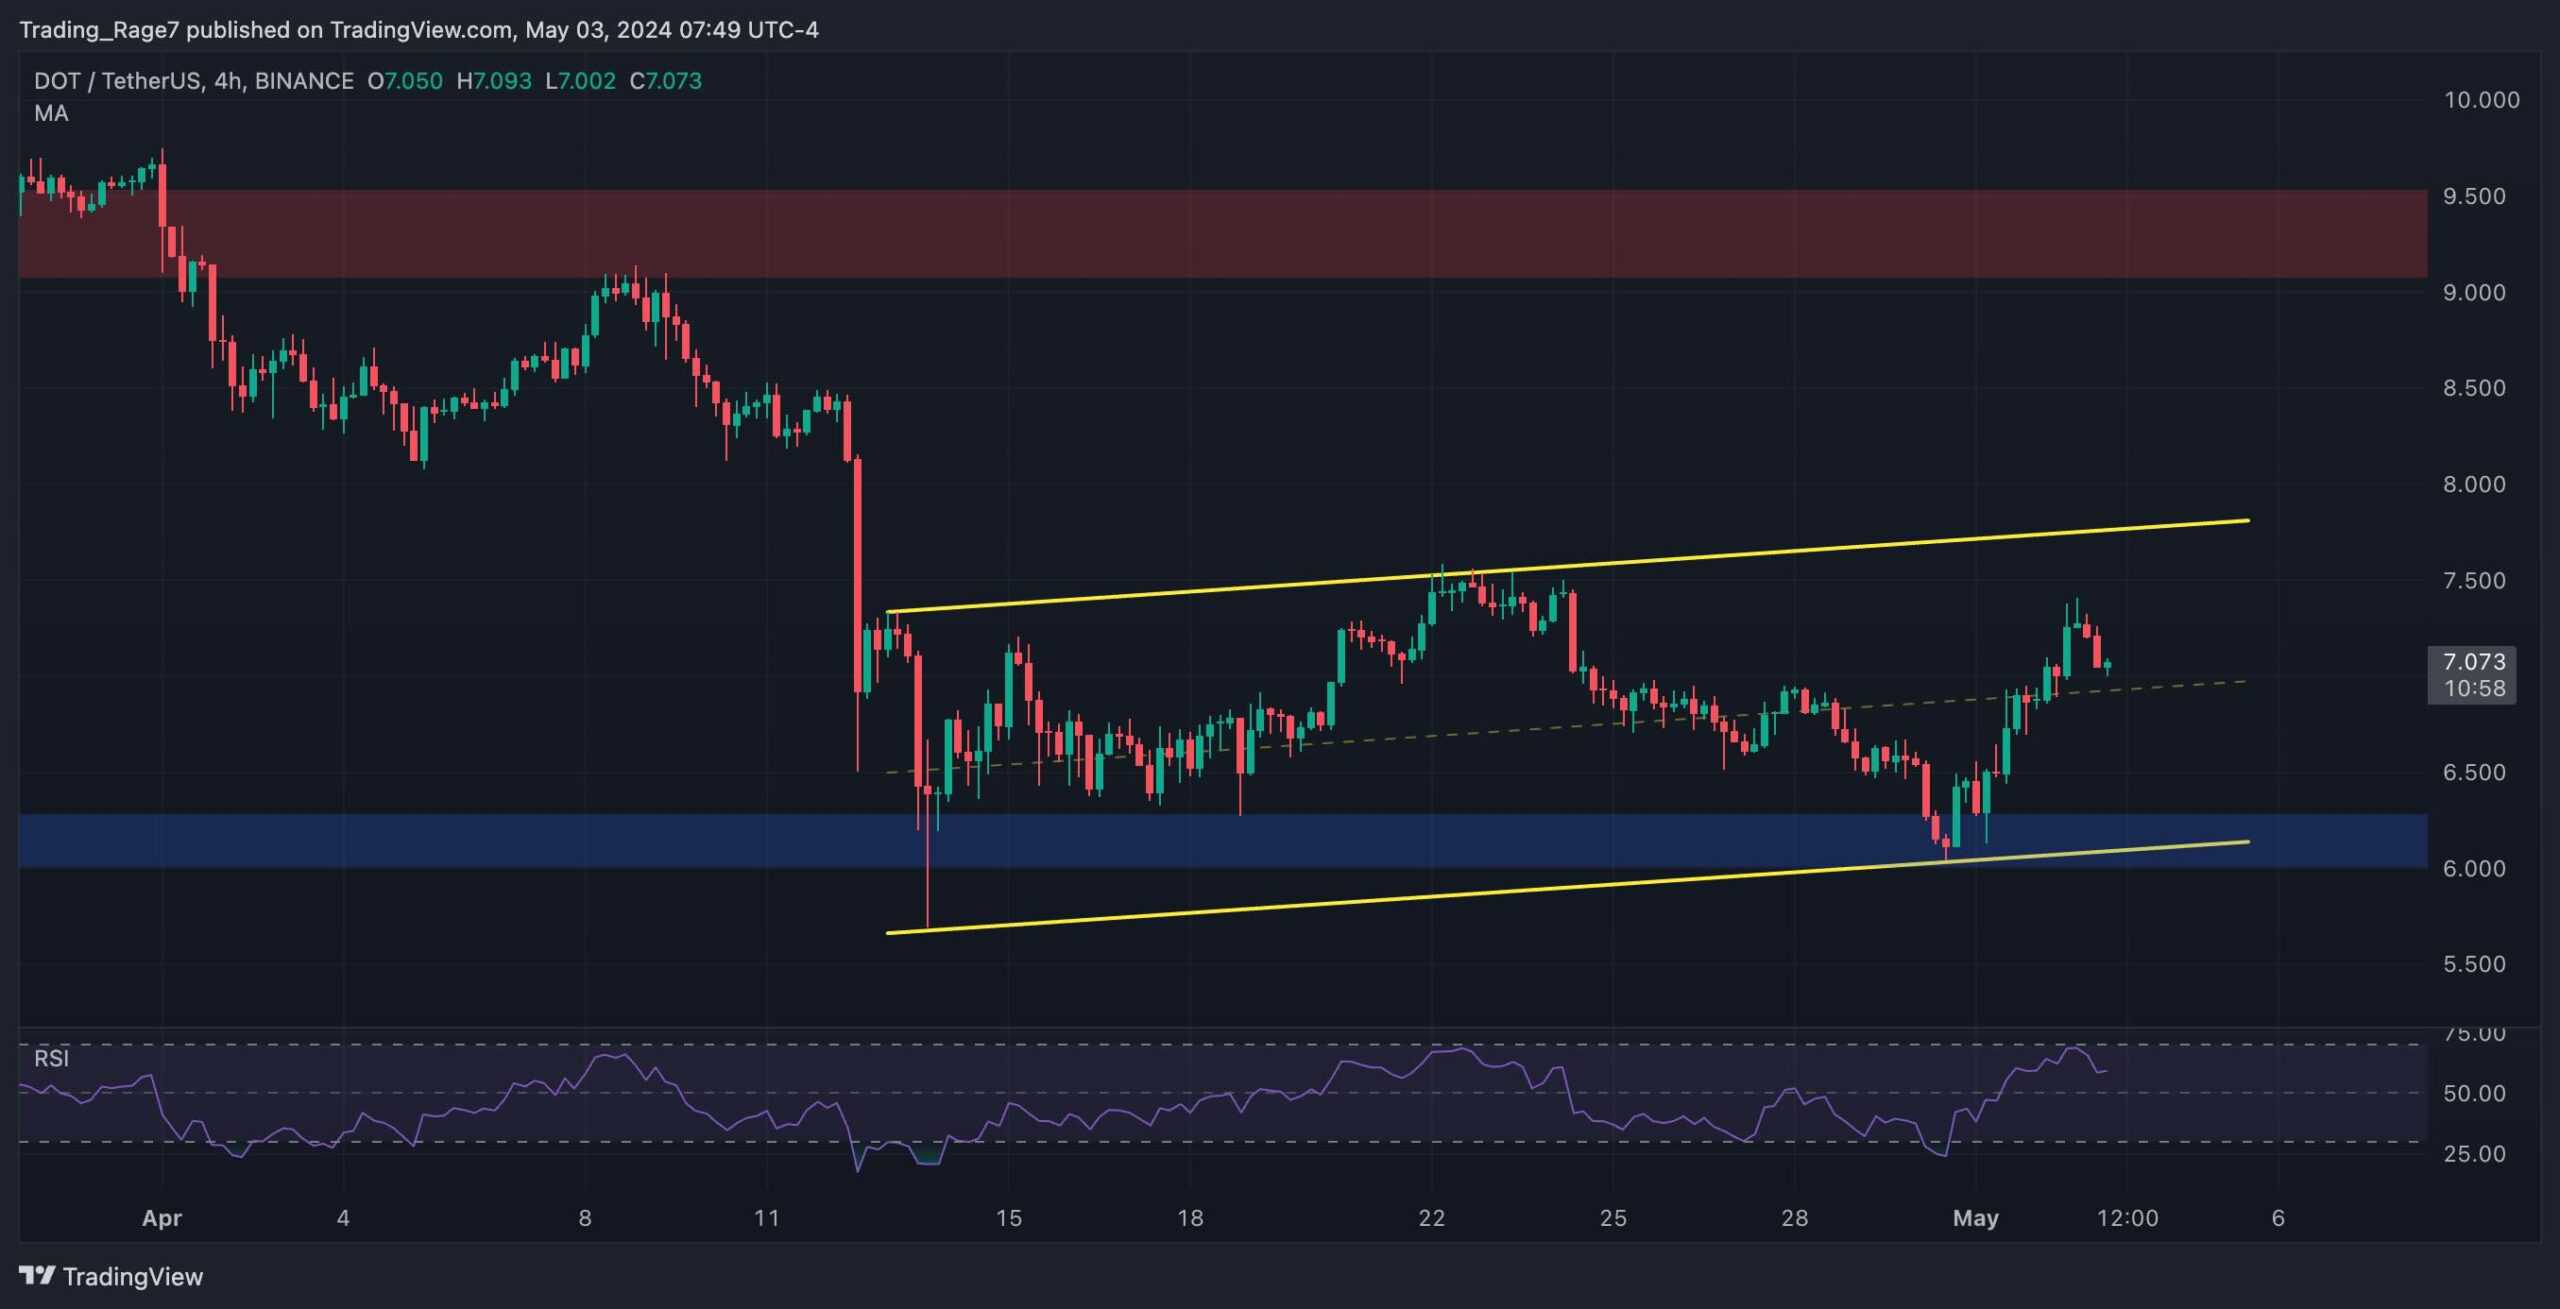
The 4-Hour Chart
DOT’s 4-hour chart paints a zoomed-in picture of the recent price action. The cryptocurrency is currently consolidating inside an ascending channel above the $6 support level.
The midline of the channel has been broken to the upside, and the price is likely to continue toward the higher boundary of the pattern in the short term.
Yet, investors should be wary, as the RSI is approaching the overbought area, and could soon signal a bearish reversal. In this case, the market would likely break the channel to the downside and drop even lower.
Sentiment Analysis
By TradingRage
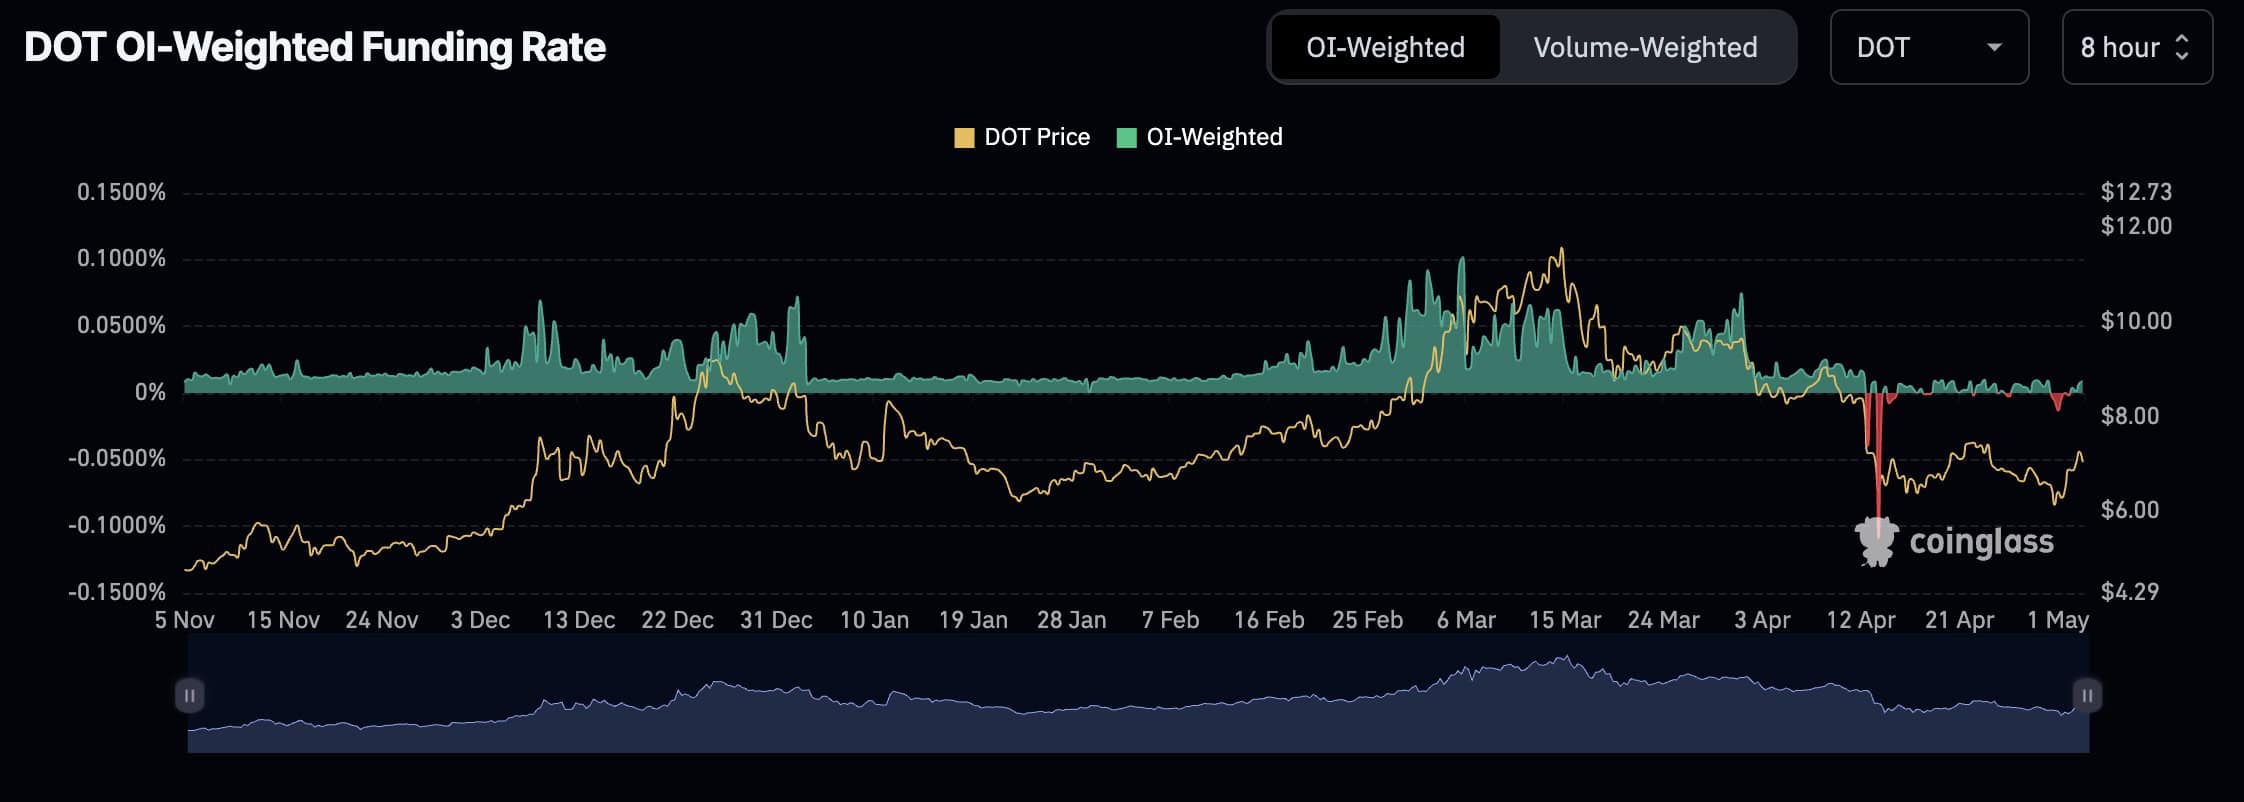
Polkadot OI-Weighted Funding Rates
During the recent DOT price decline, many long positions were liquidated. The OI-Weighted Funding Rates metric has dropped significantly, indicating that the futures market on the buy-side is no longer overheated.
Considering these funding rates, and the price consolidation, the market is likely to be forming a bottom. Therefore, if sufficient supply comes in from the spot market, DOT could see a rise in value once again.