Solana failed to sustain its bullish momentum and has lots its uptrend.
Key Support levels: $78
Key Resistance levels: $104
1. Bearish Breakdown in Progress
As soon as Solana fell under $100, the momentum shifted bearish and sellers took over the price action. Over the weekend, the price broke below its uptrend which put an end the rally that started in October 2023.
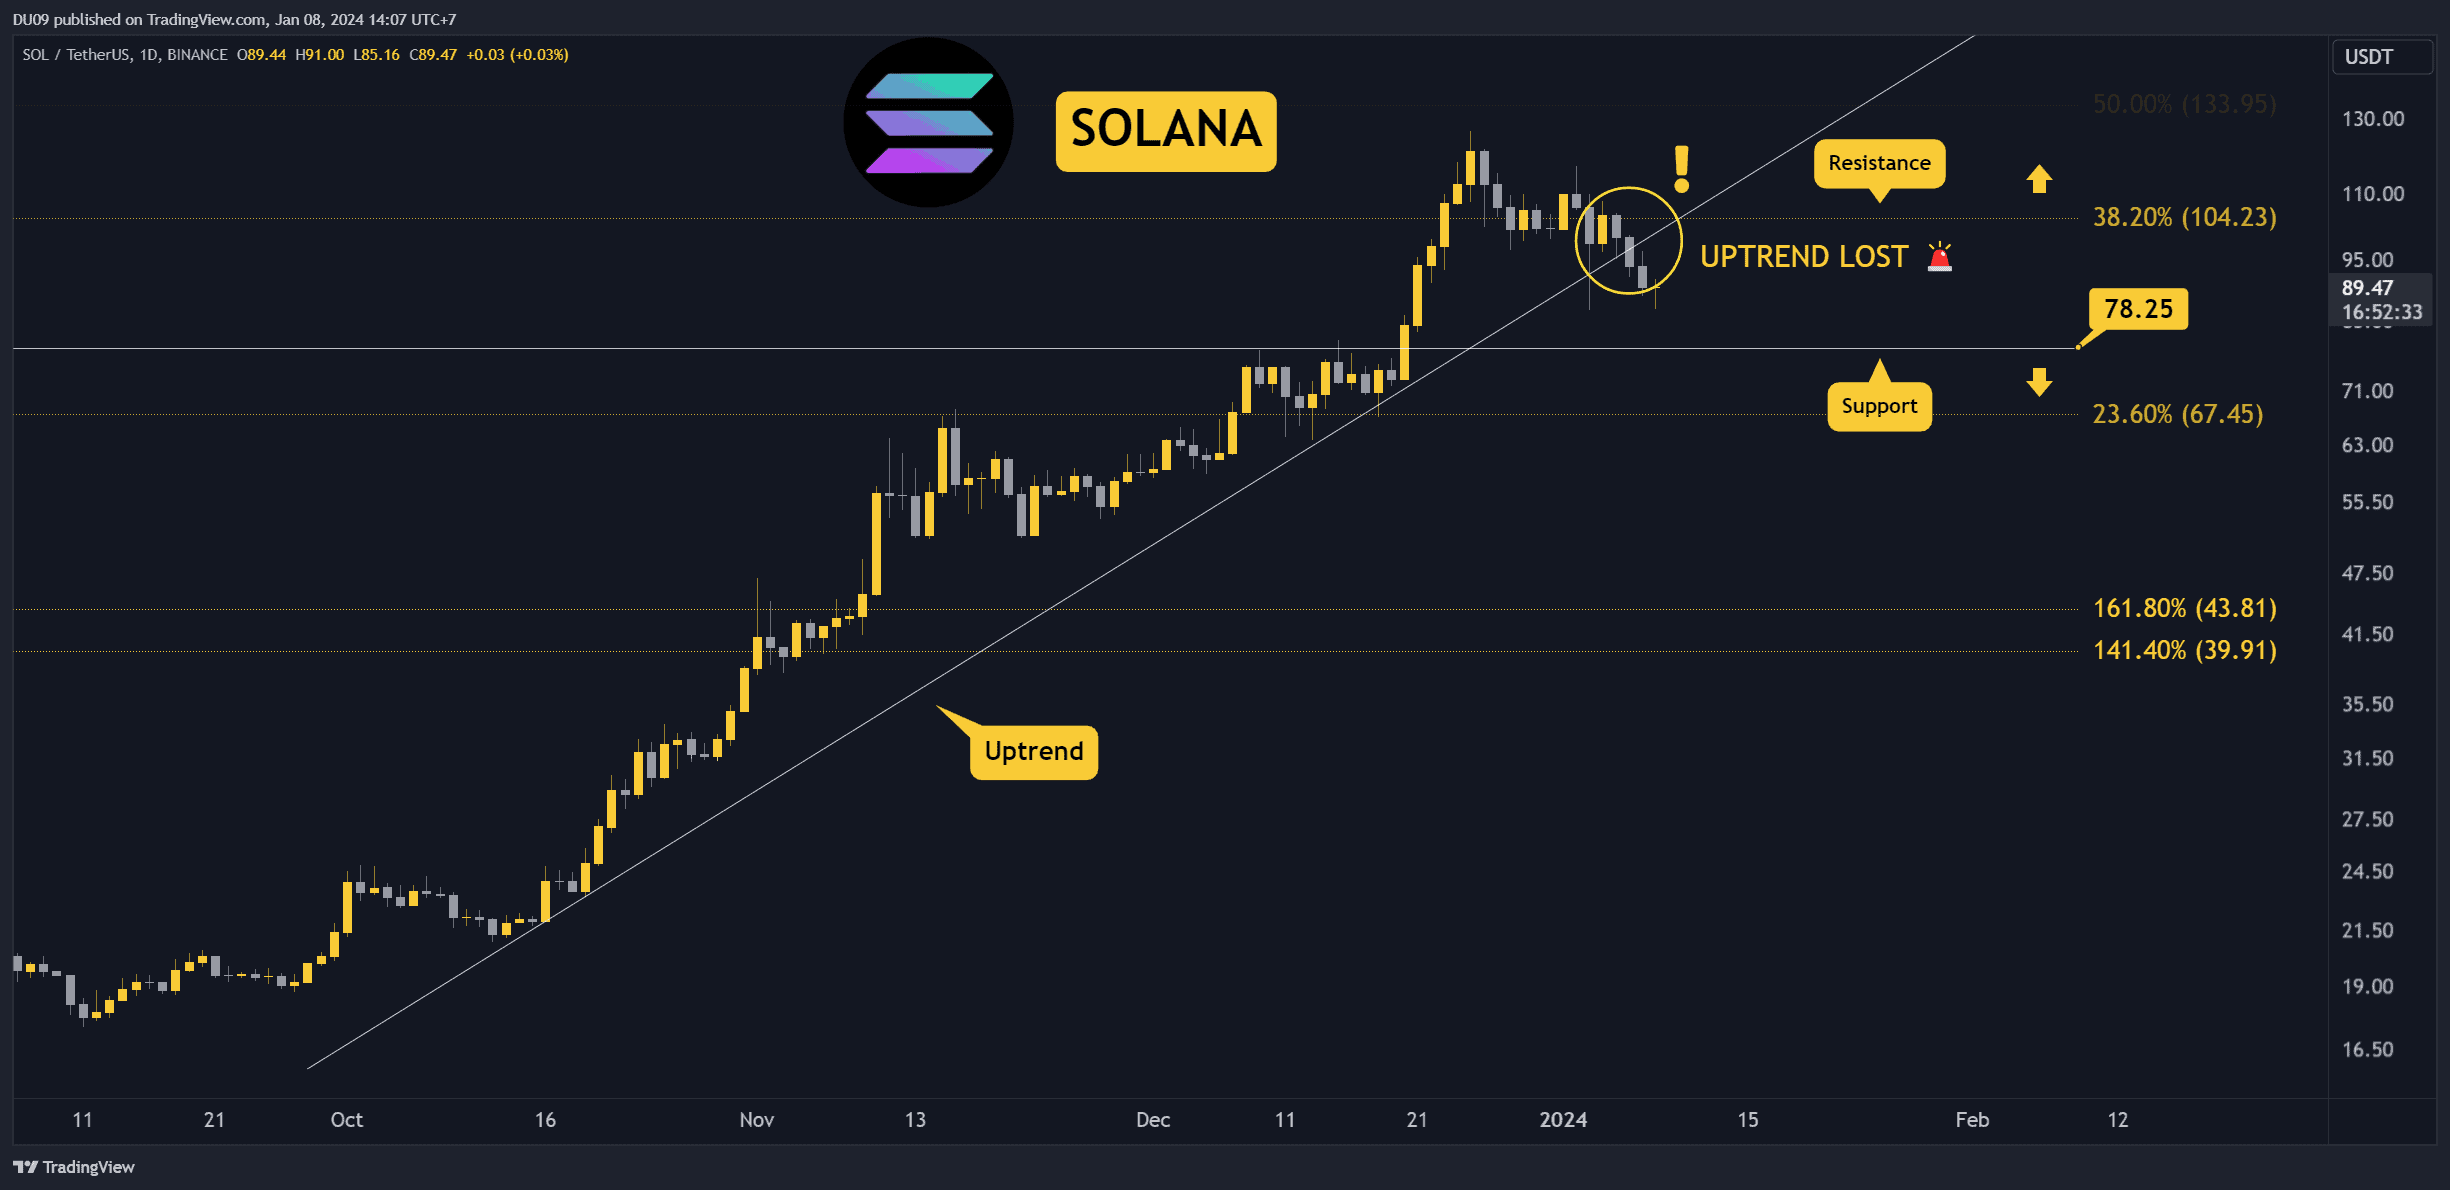
2. Key Support at $78
With buyers on the defensive, the first key support level where they could stop this correction is found at $78. This level used to act as a resistance on the way up and now it can act as support.
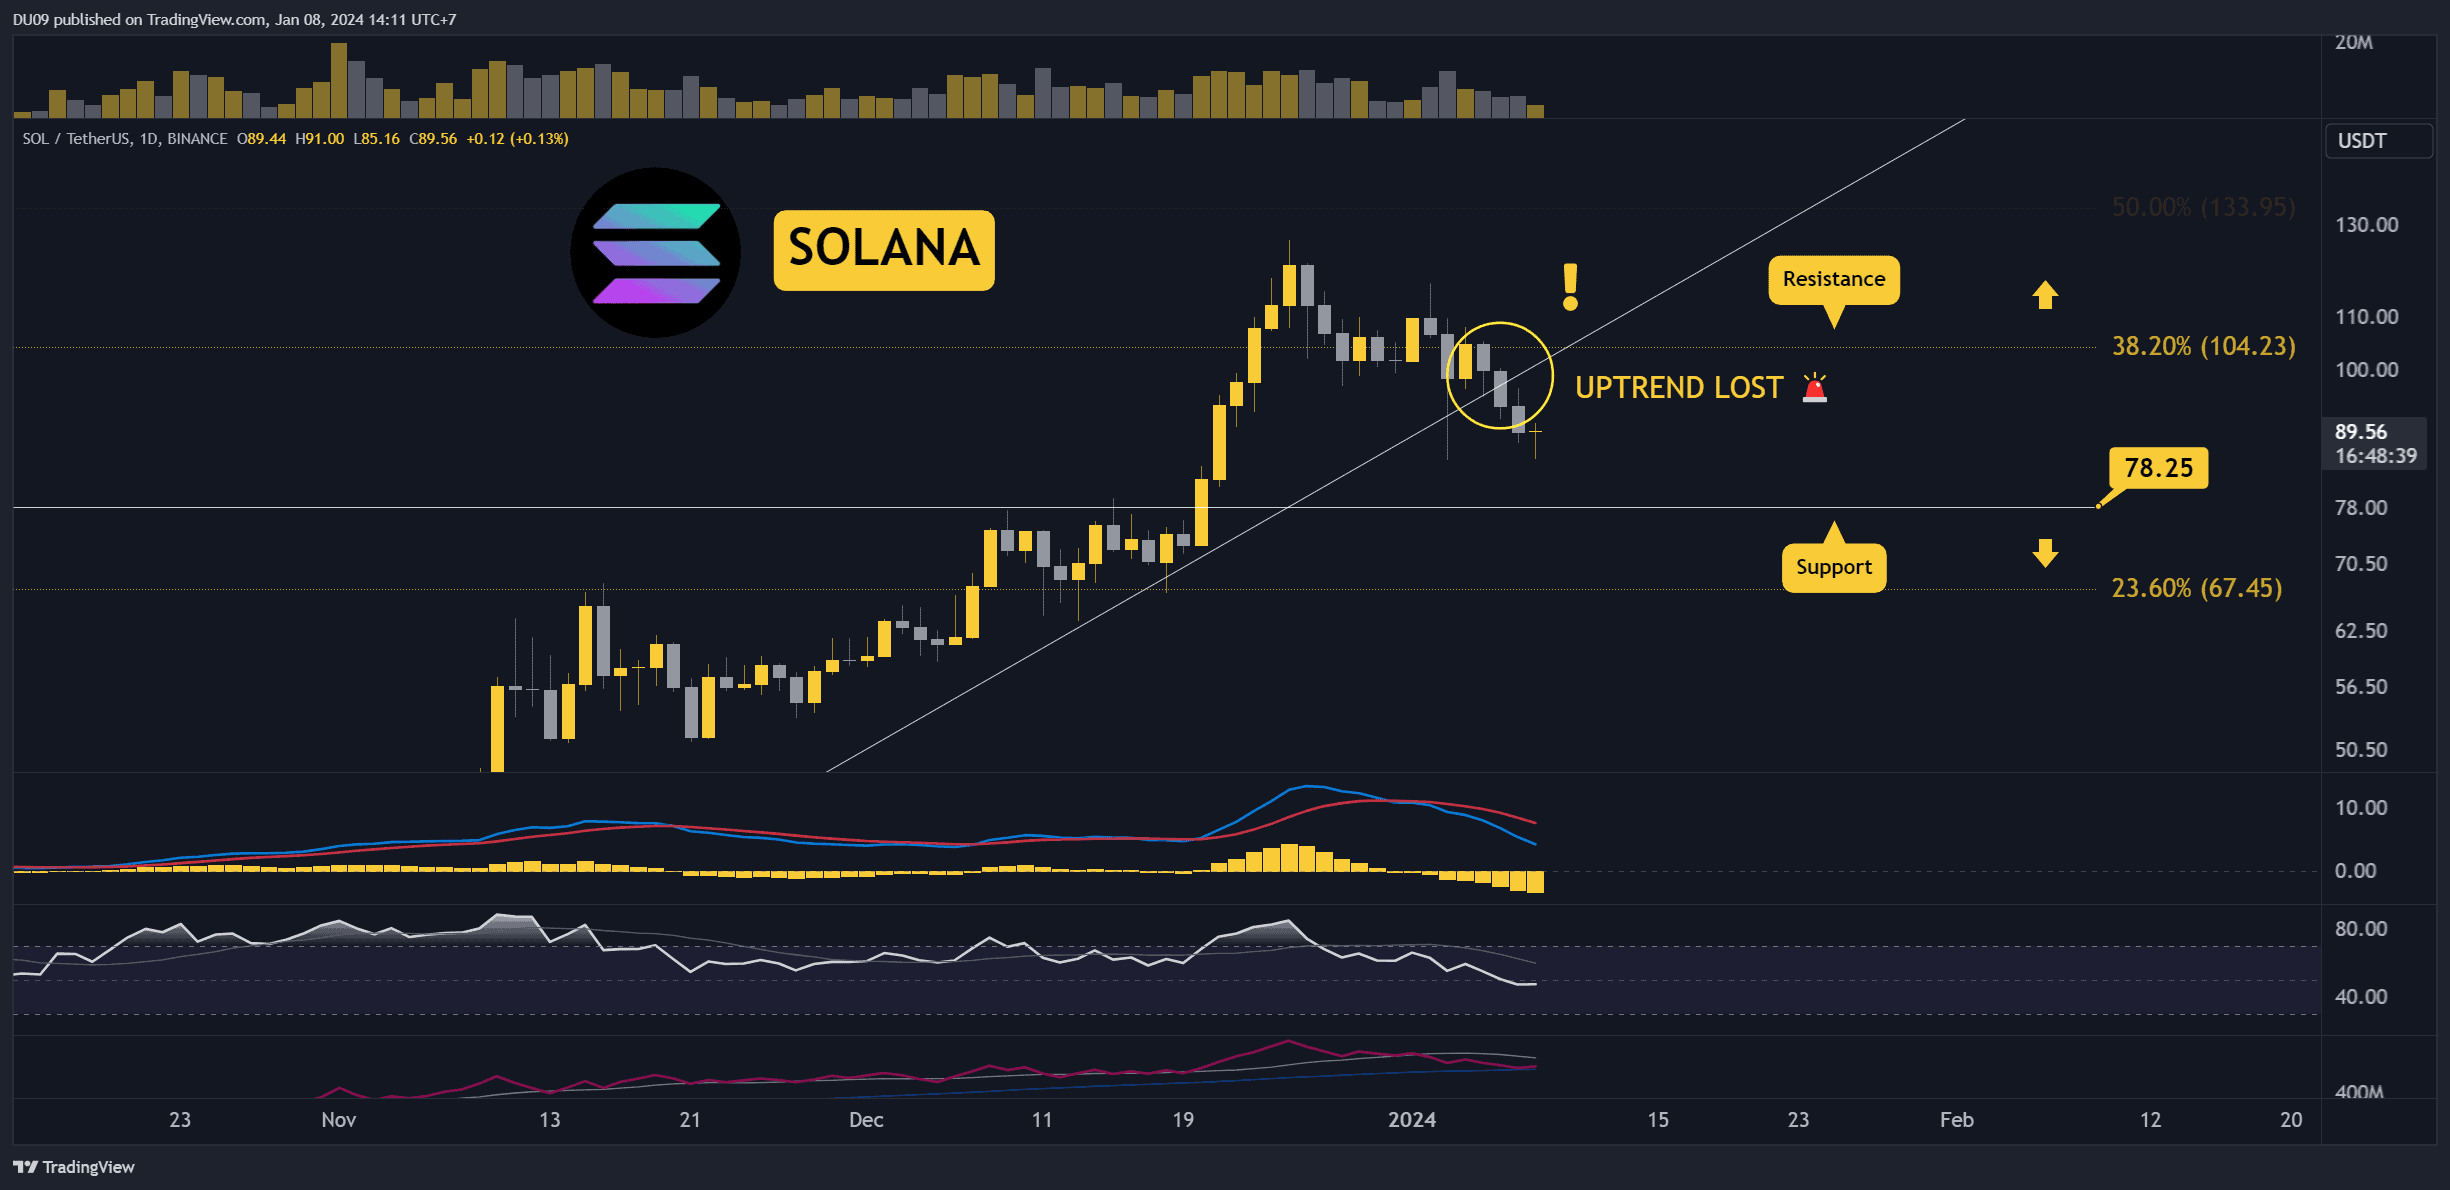
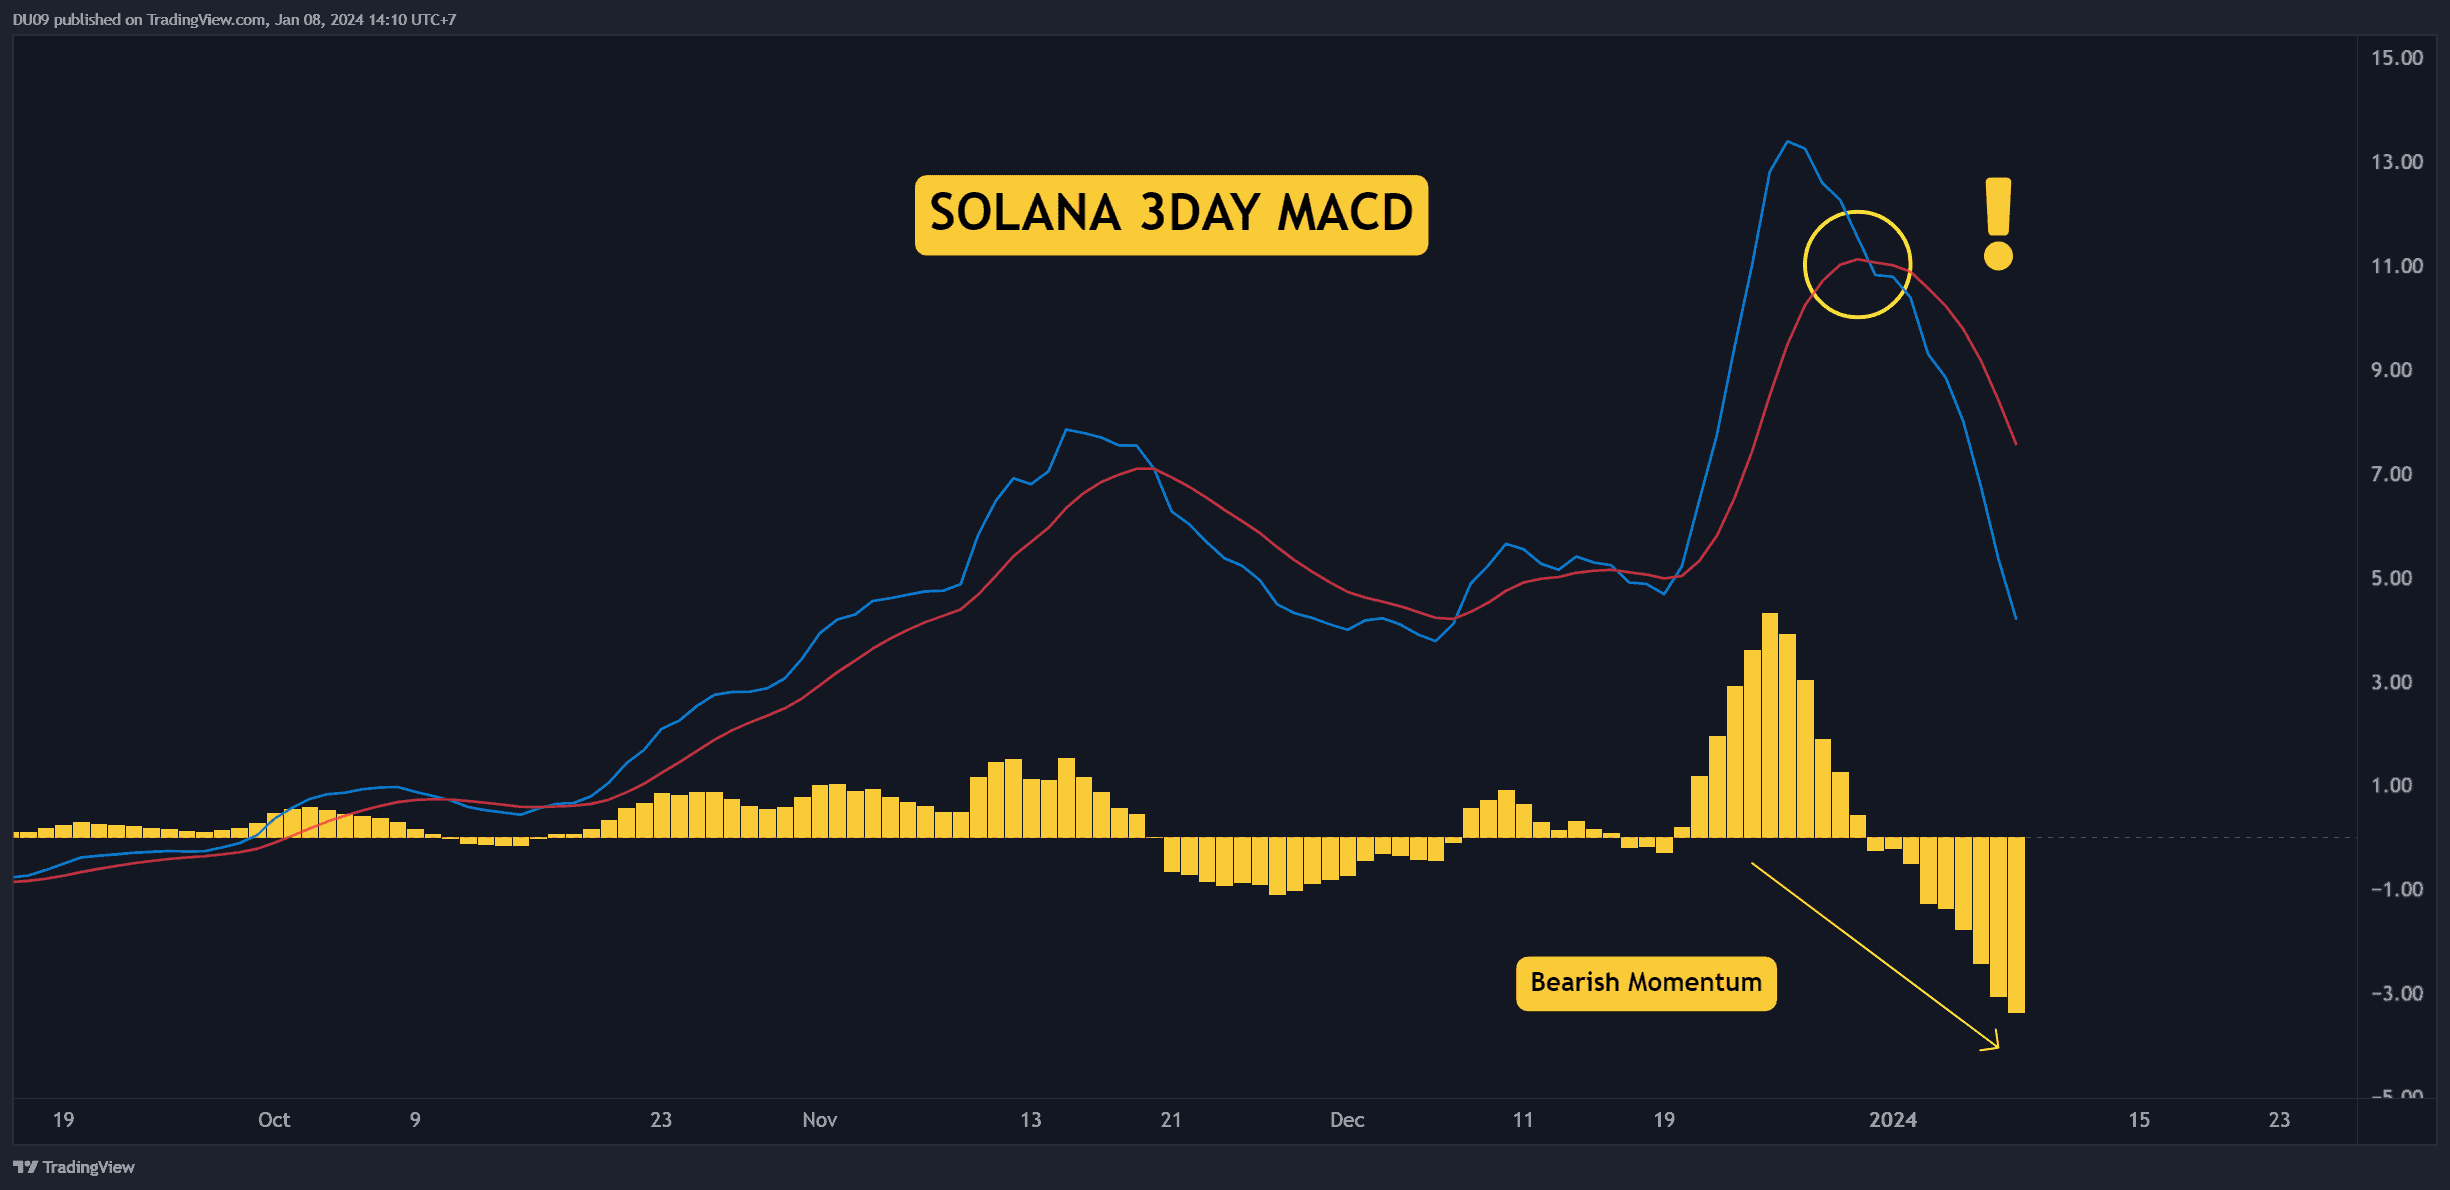
3. MACD Bearish Momentum Intensifies
The MACD histogram and moving averages are falling at an increasing speed which is a bearish signal that shows sellers dominate right now. SOL’s price will likely continue to fall as a result.
Bias
The bias for SOL is bearish.
Short-Term Prediction for SOL Price
All eyes are now on the key support at $78 which is the most significant support level on the chart. If buyers don’t return there, then this correction may last longer than anticipated.
Cryptocurrency charts by TradingView.