Ripple’s price has been consolidating on the USDT-paired chart as of late. Conversely, the BTC pair has consistently been dropping lower. Yet, the price action might turn around in the coming days.
Technical Analysis
By TradingRage
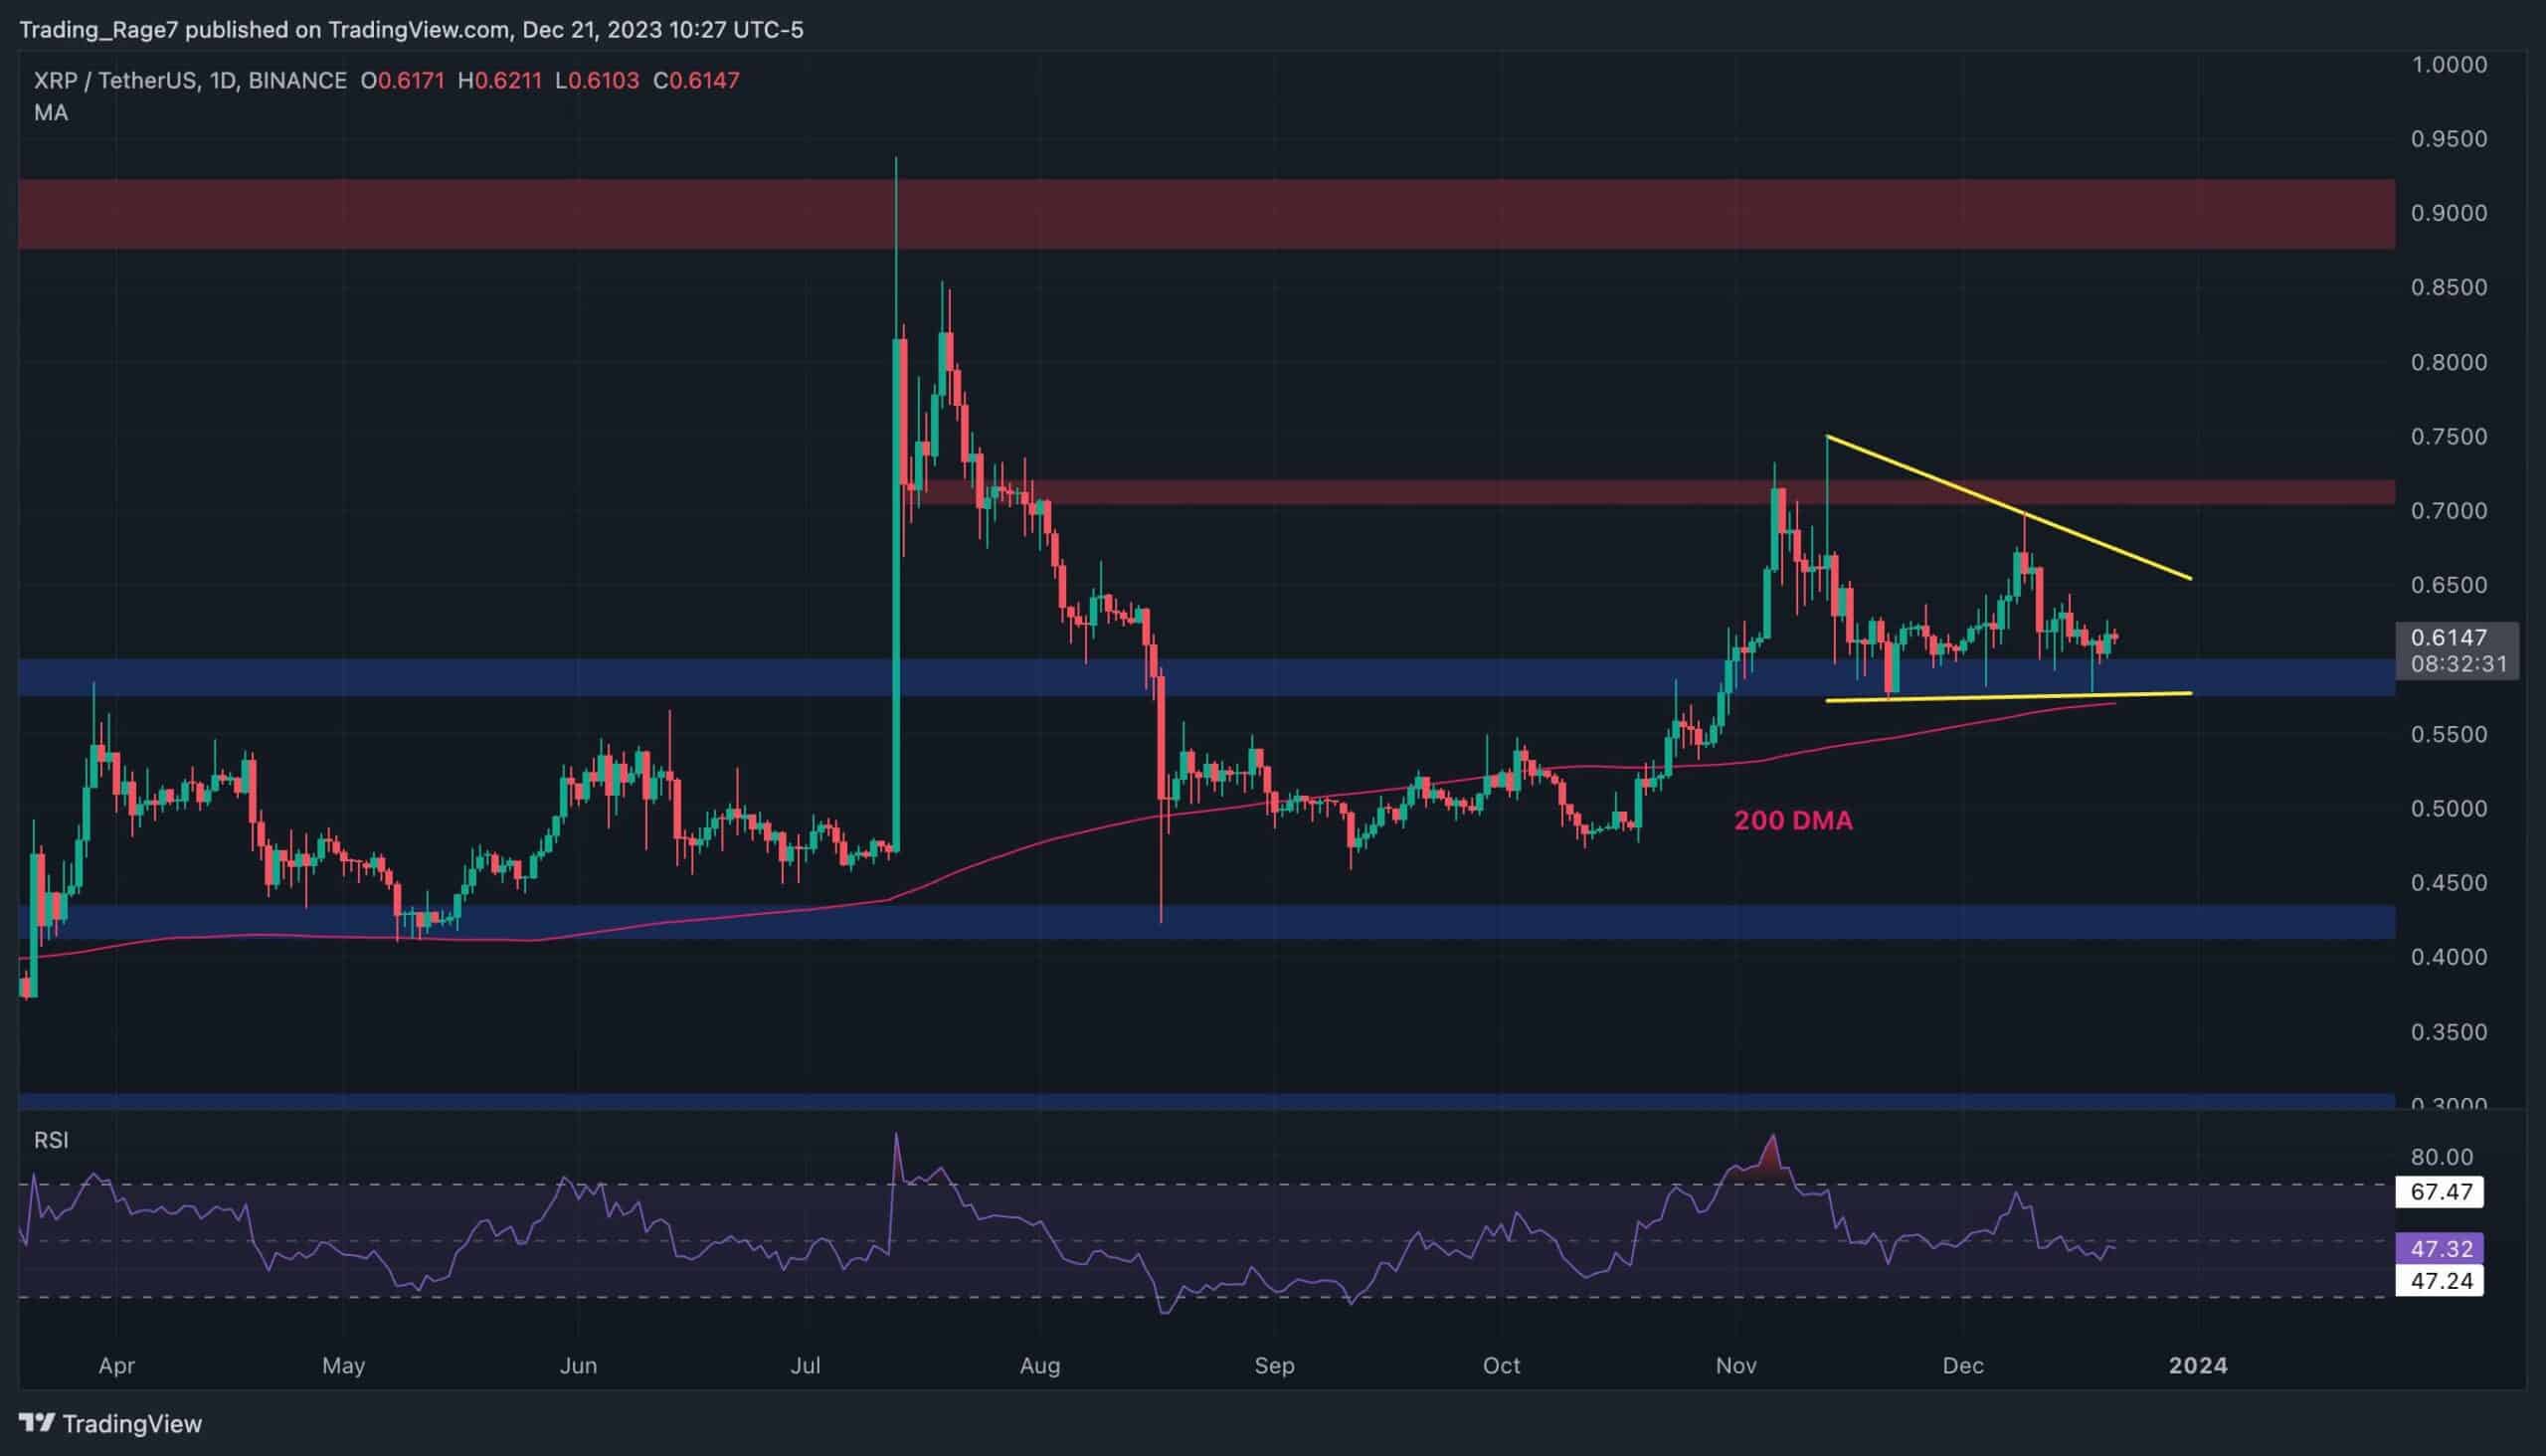
Ripple Price Analysis: The USDT-Paired Chart
Looking at the USDT pair, the price has been consolidating between the $0.6 and $0.7 levels over the last few weeks. A triangle pattern has been formed, and the price has yet to break out on either side.
The $0.6 support level further enforces the lower boundary of the pattern and the 200-day moving average trending nearby. Therefore, it seems more likely that the price will push higher and break the pattern to the upside. In this case, the market can rally toward the $0.7 resistance level and even beyond.
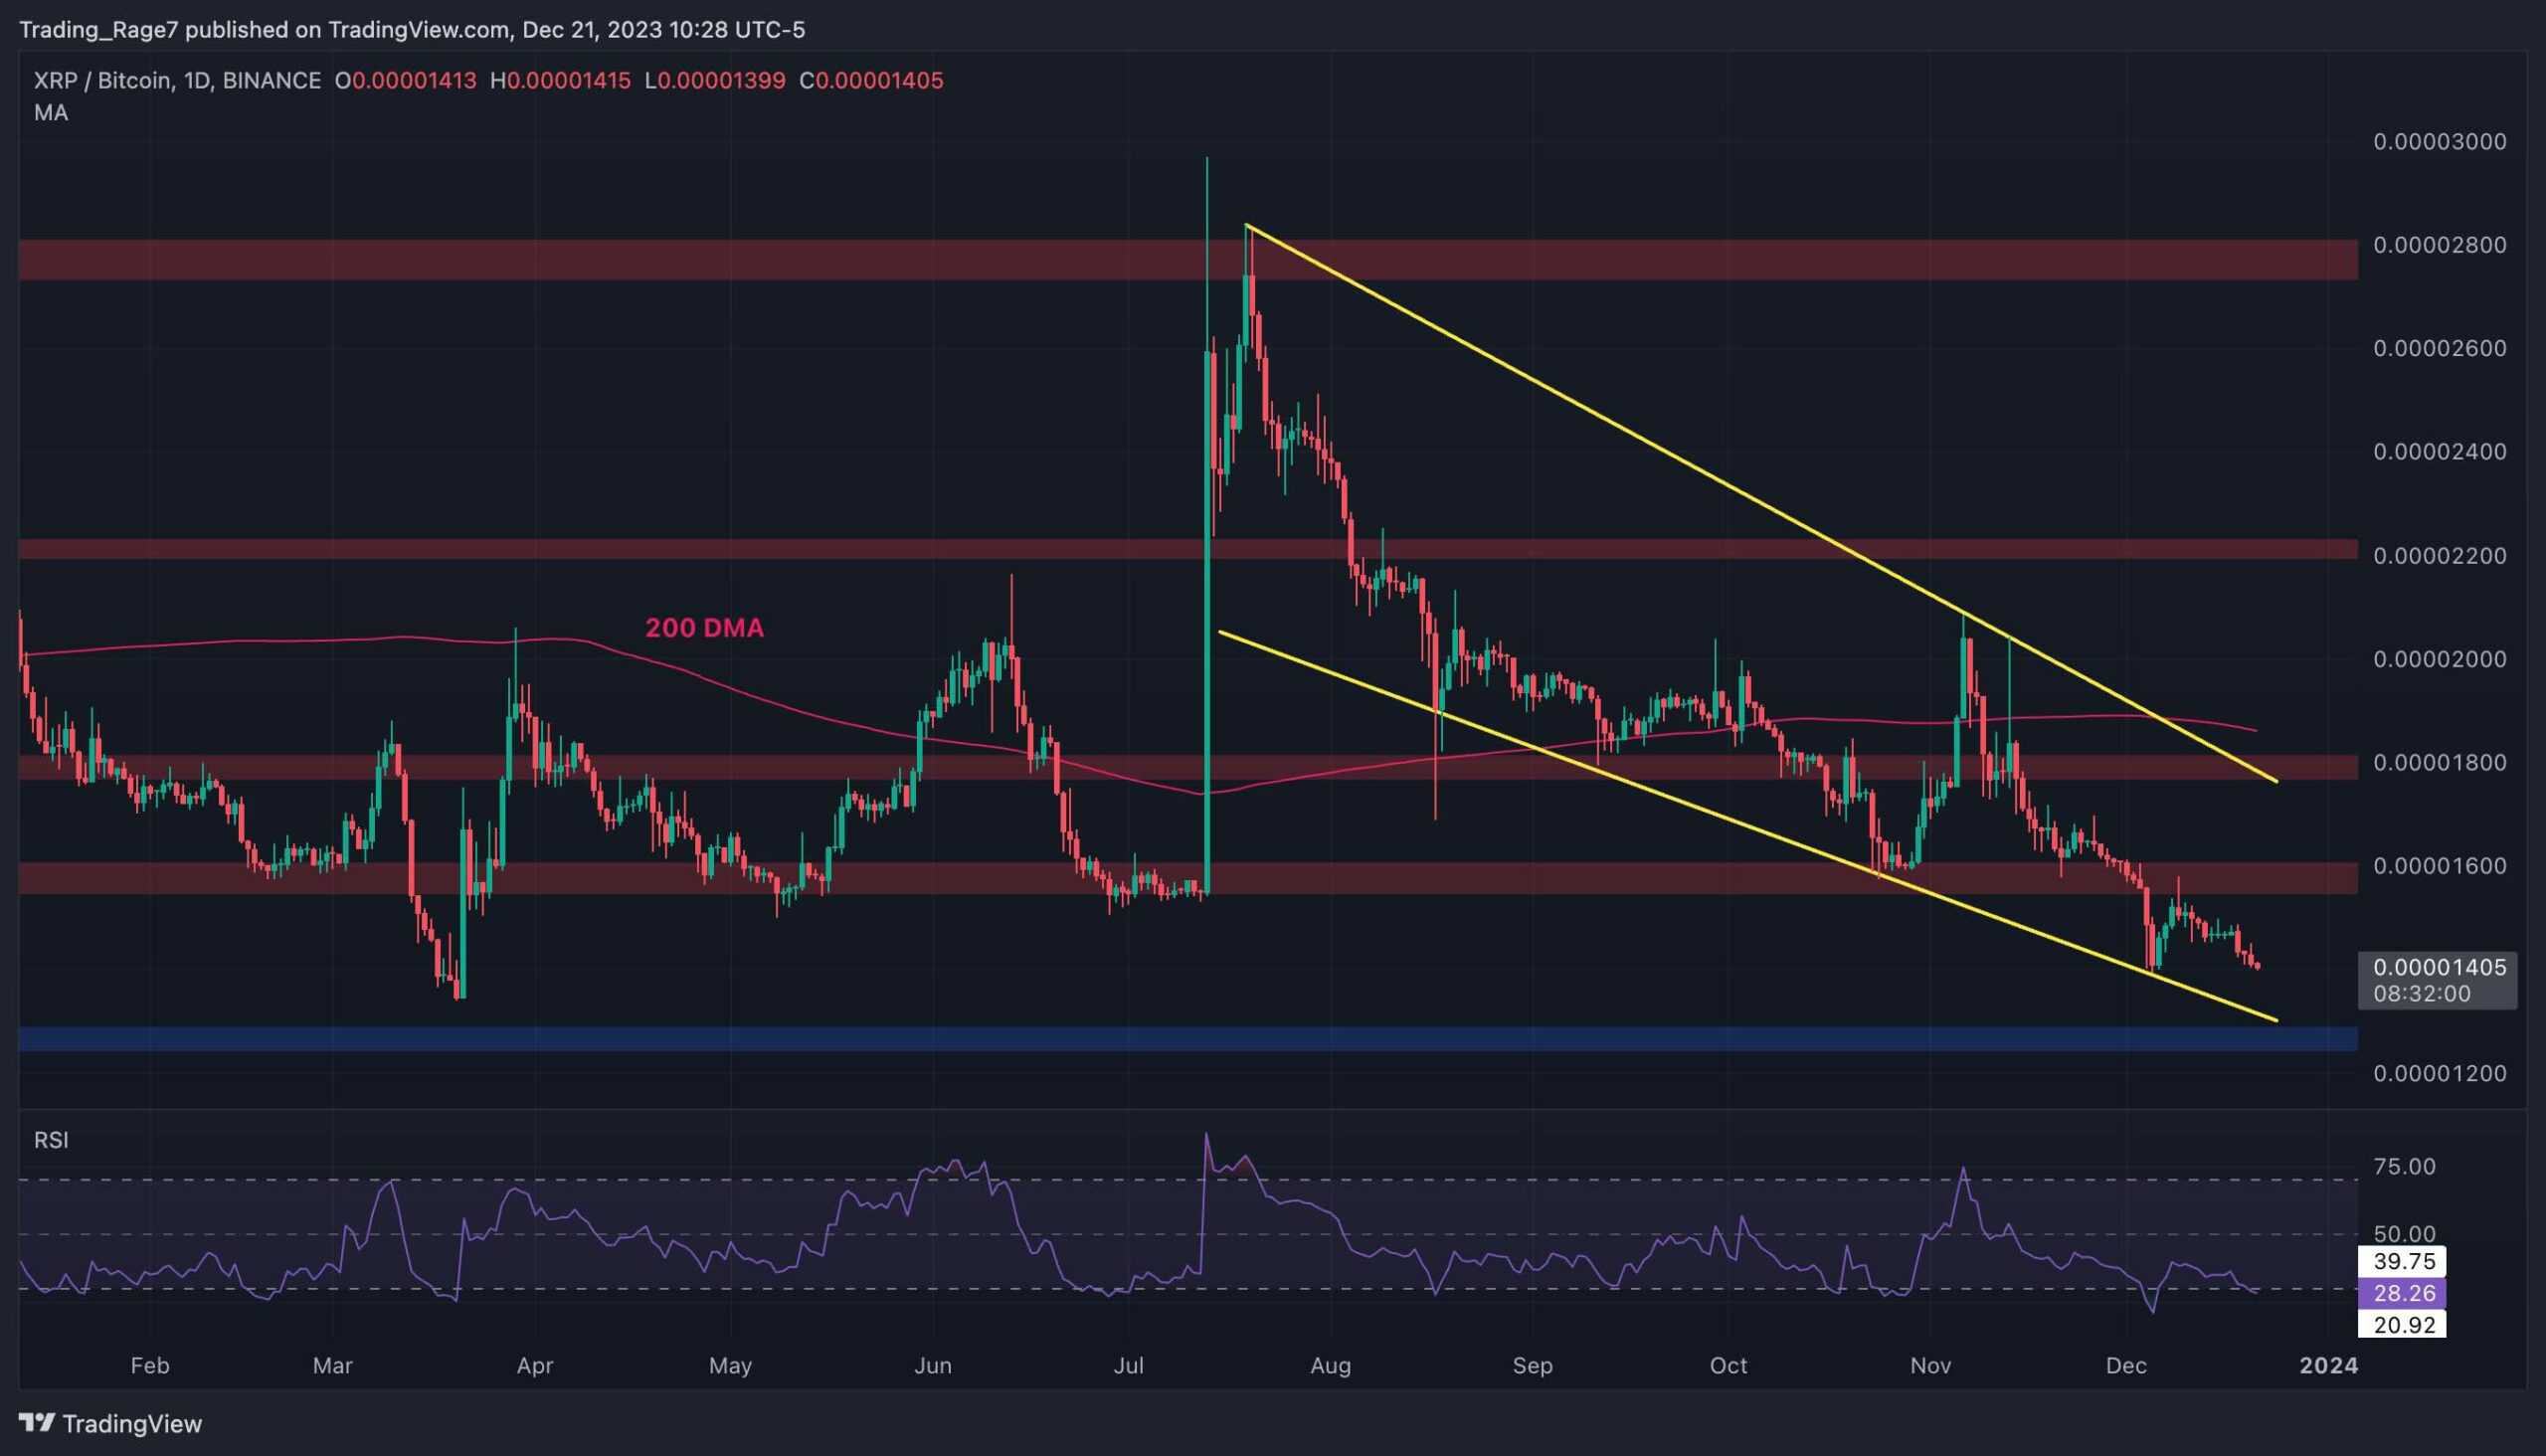
The BTC Paired Chart
Against Bitcoin, things look much worse for Ripple. The price has been making lower highs and lows since August and has yet to shift bullishly. It is trapped in a large descending channel and has broken below multiple support levels.
Yet, the market is approaching the channel’s lower boundary once more, as well as the 1300 SAT support zone. Consequently, a rebound from this area seems likely to occur. However, for the trend to turn bullish, XRP’s price should first break above the descending channel.
Cryptocurrency charts by TradingView.